Introducing Hypertrace Java Agent
OpenTelemetry agent with extended data collection and filtering!

I am very excited to introduce the Hypertrace Java Agent: our first OpenTelemetry agent. For Hypertrace, we want to provide powerful instrumentation libraries that are built on top of industry standards and best practices that we’ve learned over the past few years. The Hypertrace Java agent is not an exception and is built on top of the OpenTelemetry Java agent adding new powerful capabilities.
Why yet another OpenTelemetry Java agent distribution?
The OpenTelemetry project provides a powerful set of capabilities for multi-signal data instrumentation and collection. However, the configuration story is very generic and not straightforward for an end user that is not familiar with OpenTelemetry concepts and distributed tracing in general. For Hypertrace we want to solve this problem as well as provide more features on top of OpenTelemetry!
Hypertrace agents are consistently configured to work with the Hypertrace API observability platform.
In addition to supporting all OpenTelemetry features and OpenTelemetry supported frameworks,
the Hypertrace agents are capable of capturing all traffic that flows through the application.
It literally means that agents can capture all request and response headers and bodies. From the
observability perspective this brings full transparency of the data flow in your environment.
Another important capability our agents bring to the community is an ability to run custom filters
for every incoming request. These filters receive headers and bodies as input requests. For instance,
the implementation can calculate interesting statistics based on the data flowing through the system.
The result returned from the filter is used to block the request processing. For example, it will
return HTTP code 403 if a certain header is present. This is a very powerful feature and somewhat
similar to Envoy proxy functionality, however Hypertrace agents run directly in the application process.
Let’s summarize the Hypetrace Java agent’s capabilities:
- All OpenTelemetry Java agent frameworks and features
- Consistent configuration across Hypertrace agents via agent-config.
- HTTP request and response headers and body capture. The body capture is enabled for
application/json,application/graphqlandapplication/x-www-form-urlencodedcontent types. - RPC request and response metadata and body capture. gRPC messages are decoded into JSON format.
- Pluggable filter implementation that runs on incoming requests.
Try it out!
Now we are going to instrument the Spring Pet Clinic demo application with the Hypertrace Java agent and review the application APIs in the Hypertrace platform.
First let’s deploy Hypertrace locally. The instructions to deploy Hypertrace can be found on our Getting Started page. The Hypertrace UI should become available at http://localhost:2020 after about 10 seconds. Next let’s download the Hypertrace Java agent and config:
curl -OL https://github.com/hypertrace/javaagent/releases/latest/download/hypertrace-agent-all.jar
curl -OL https://raw.githubusercontent.com/hypertrace/javaagent/main/example-config.yaml
Now, let’s inspect the configuration file:
serviceName: service_name
reporting:
  address: http://localhost:9411/api/v2/spans
propagationFormats:
    - "B3"
    - "TRACE_CONTEXT"
dataCapture:
  httpHeaders:
    request: true
    response: true
  httpBody:
     request: true
  rpcMetadata:
     request: false
  rpcBody:
      request: false
We can change the serviceName to spring-pet-clinic. Note that by default, config enables data capture for all entities (all entities just for illustrative purposes).
As a final step, let’s compile and deploy instrumented Spring Pet Clinic application:
git clone https://github.com/spring-projects/spring-petclinic.git
cd spring-petclinic
./mvnw package
HT_CONFIG_FILE=example-config.yaml java -javaagent:hypertrace-agent-all.jar -jar target/*.jar
The HT_CONFIG_FILE specifies the path to the config file. All configuration properties can also
be specified as environment variables or system properties with precedence order from the lowest to the highest.
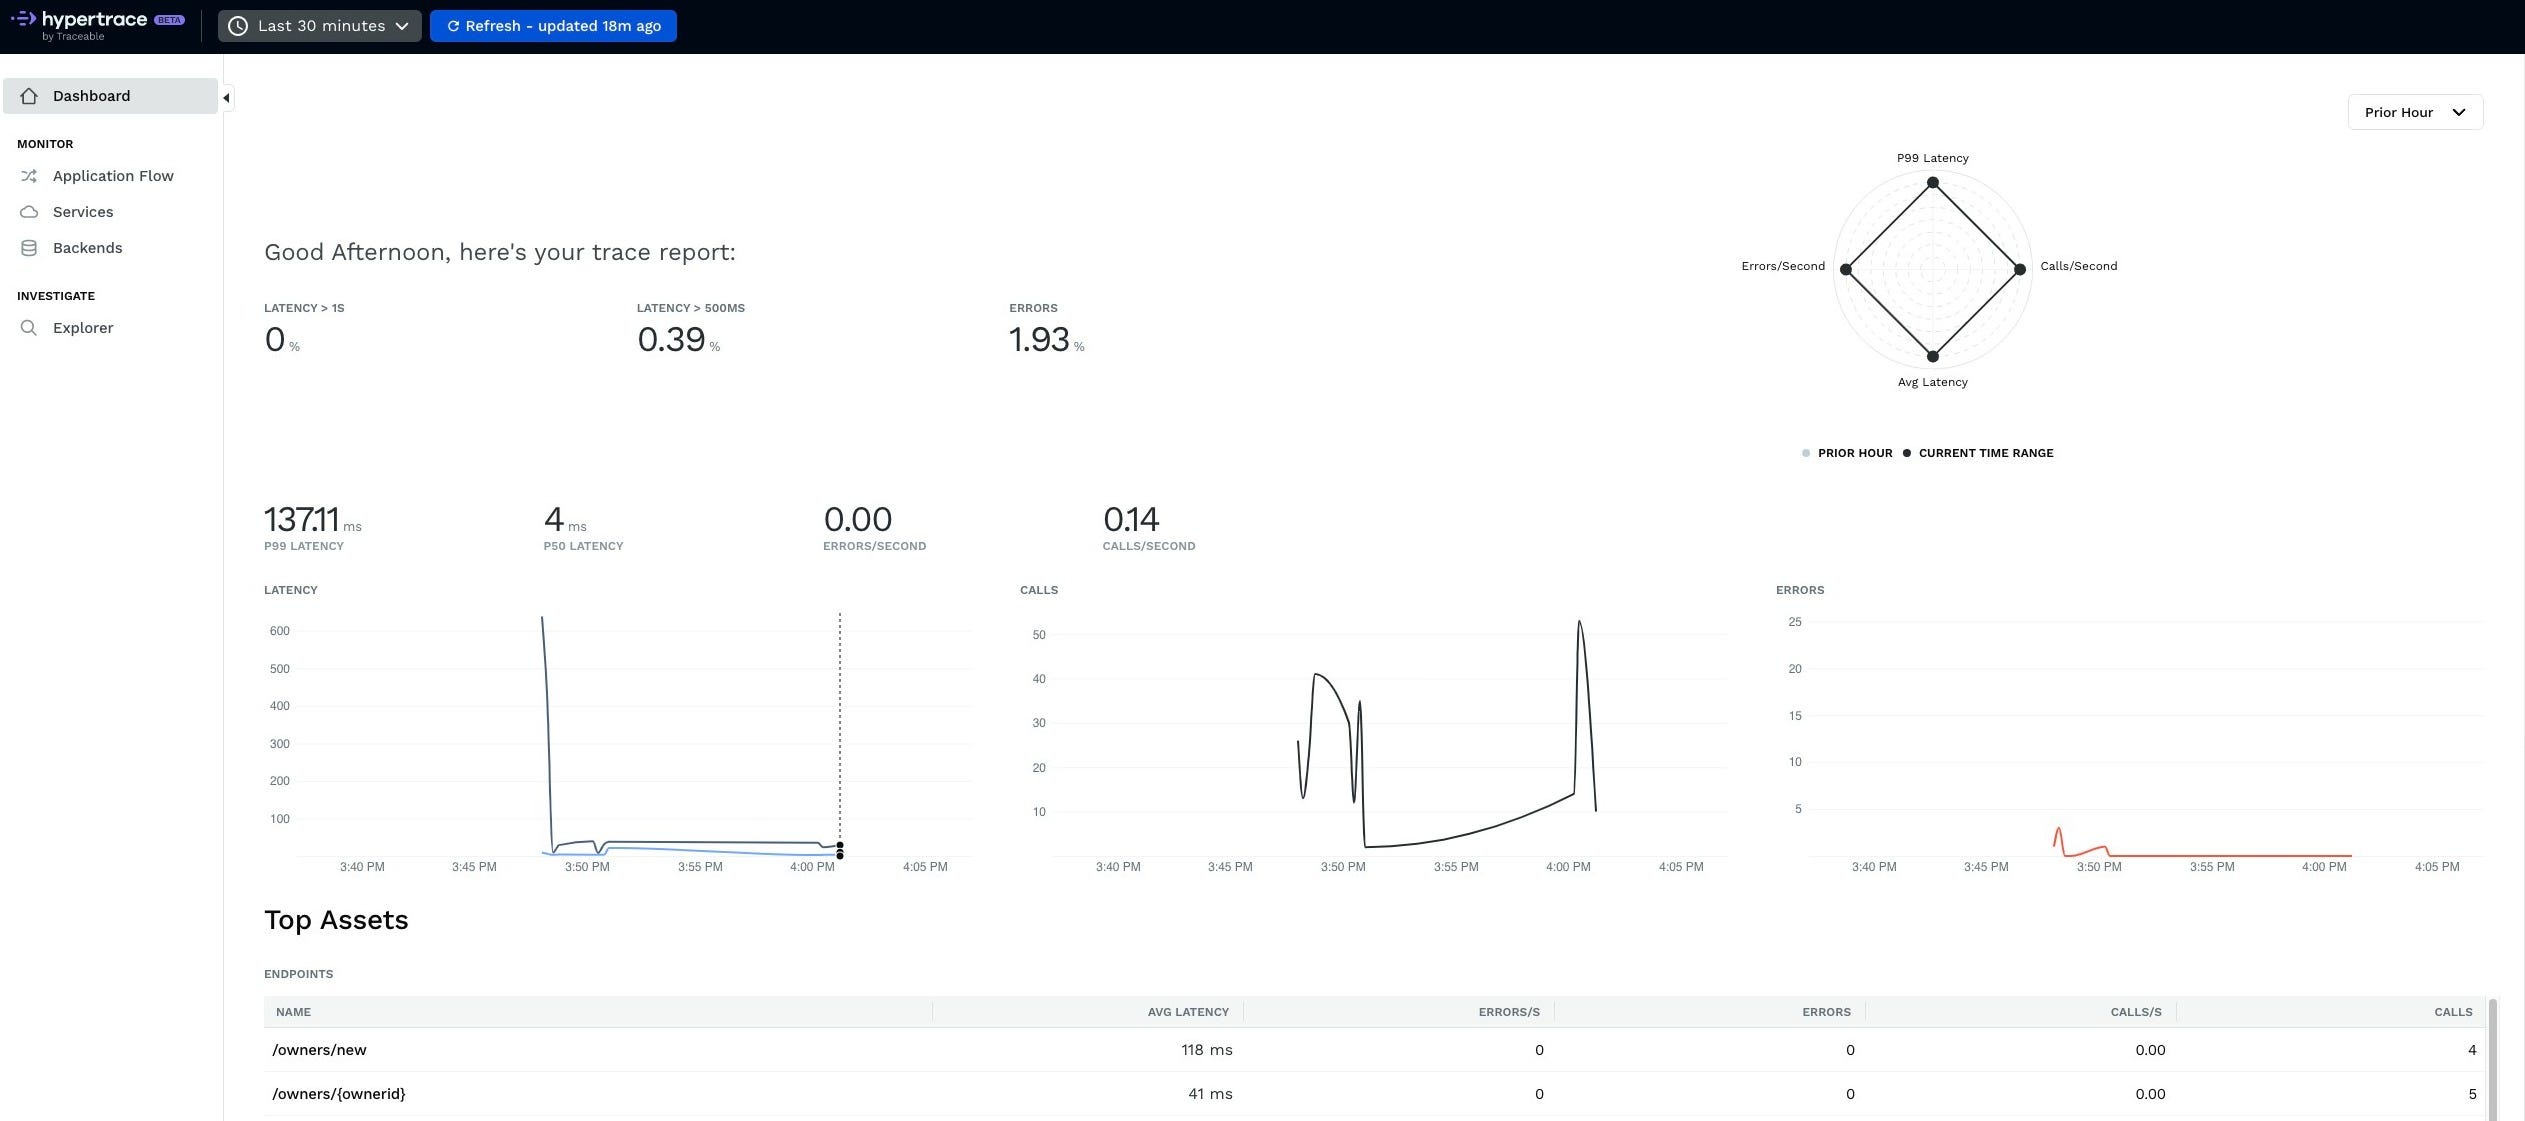
Everything is prepared so let’s make a couple of requests to the sample application available at http://localhost:8080/, and then open Hypertrace UI. The initial dashboard tab shows a high level view and overall health of the system and every endpoint from the application at the bottom.
 |
|---|
| Hypertrace dashboard |
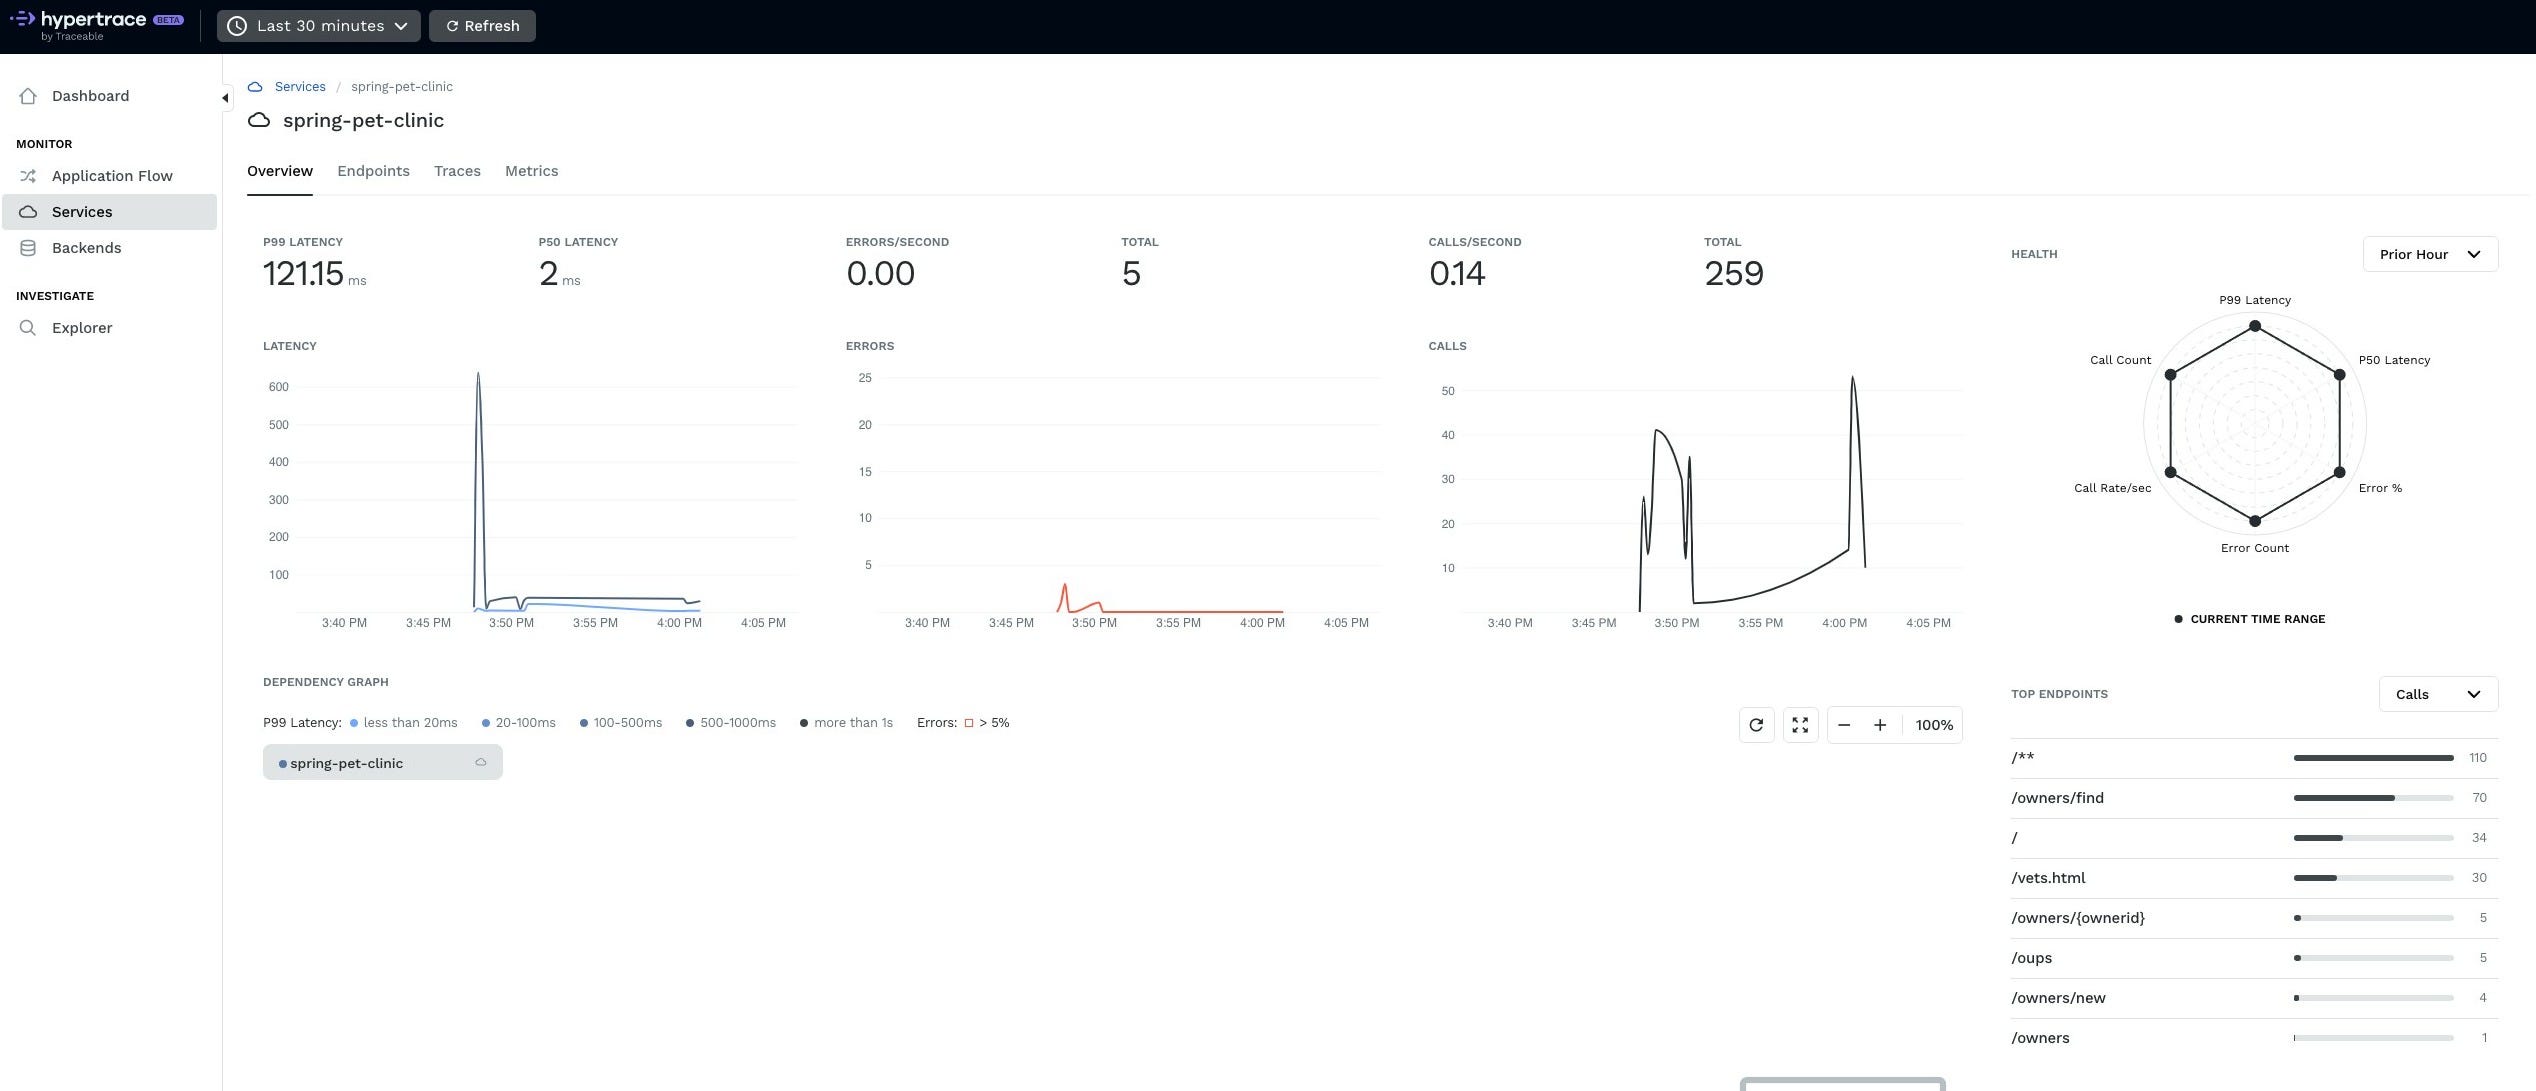
Now let’s have a look at our application in more detail. The Services tab shows a very similar macro view but scoped for the details of a single service. The charts look similar but we are monitoring only a single service. From this Service view we can navigate to endpoints, browse individual traces or see metrics derived from traces.
 |
|---|
| Hypertrace service detail |
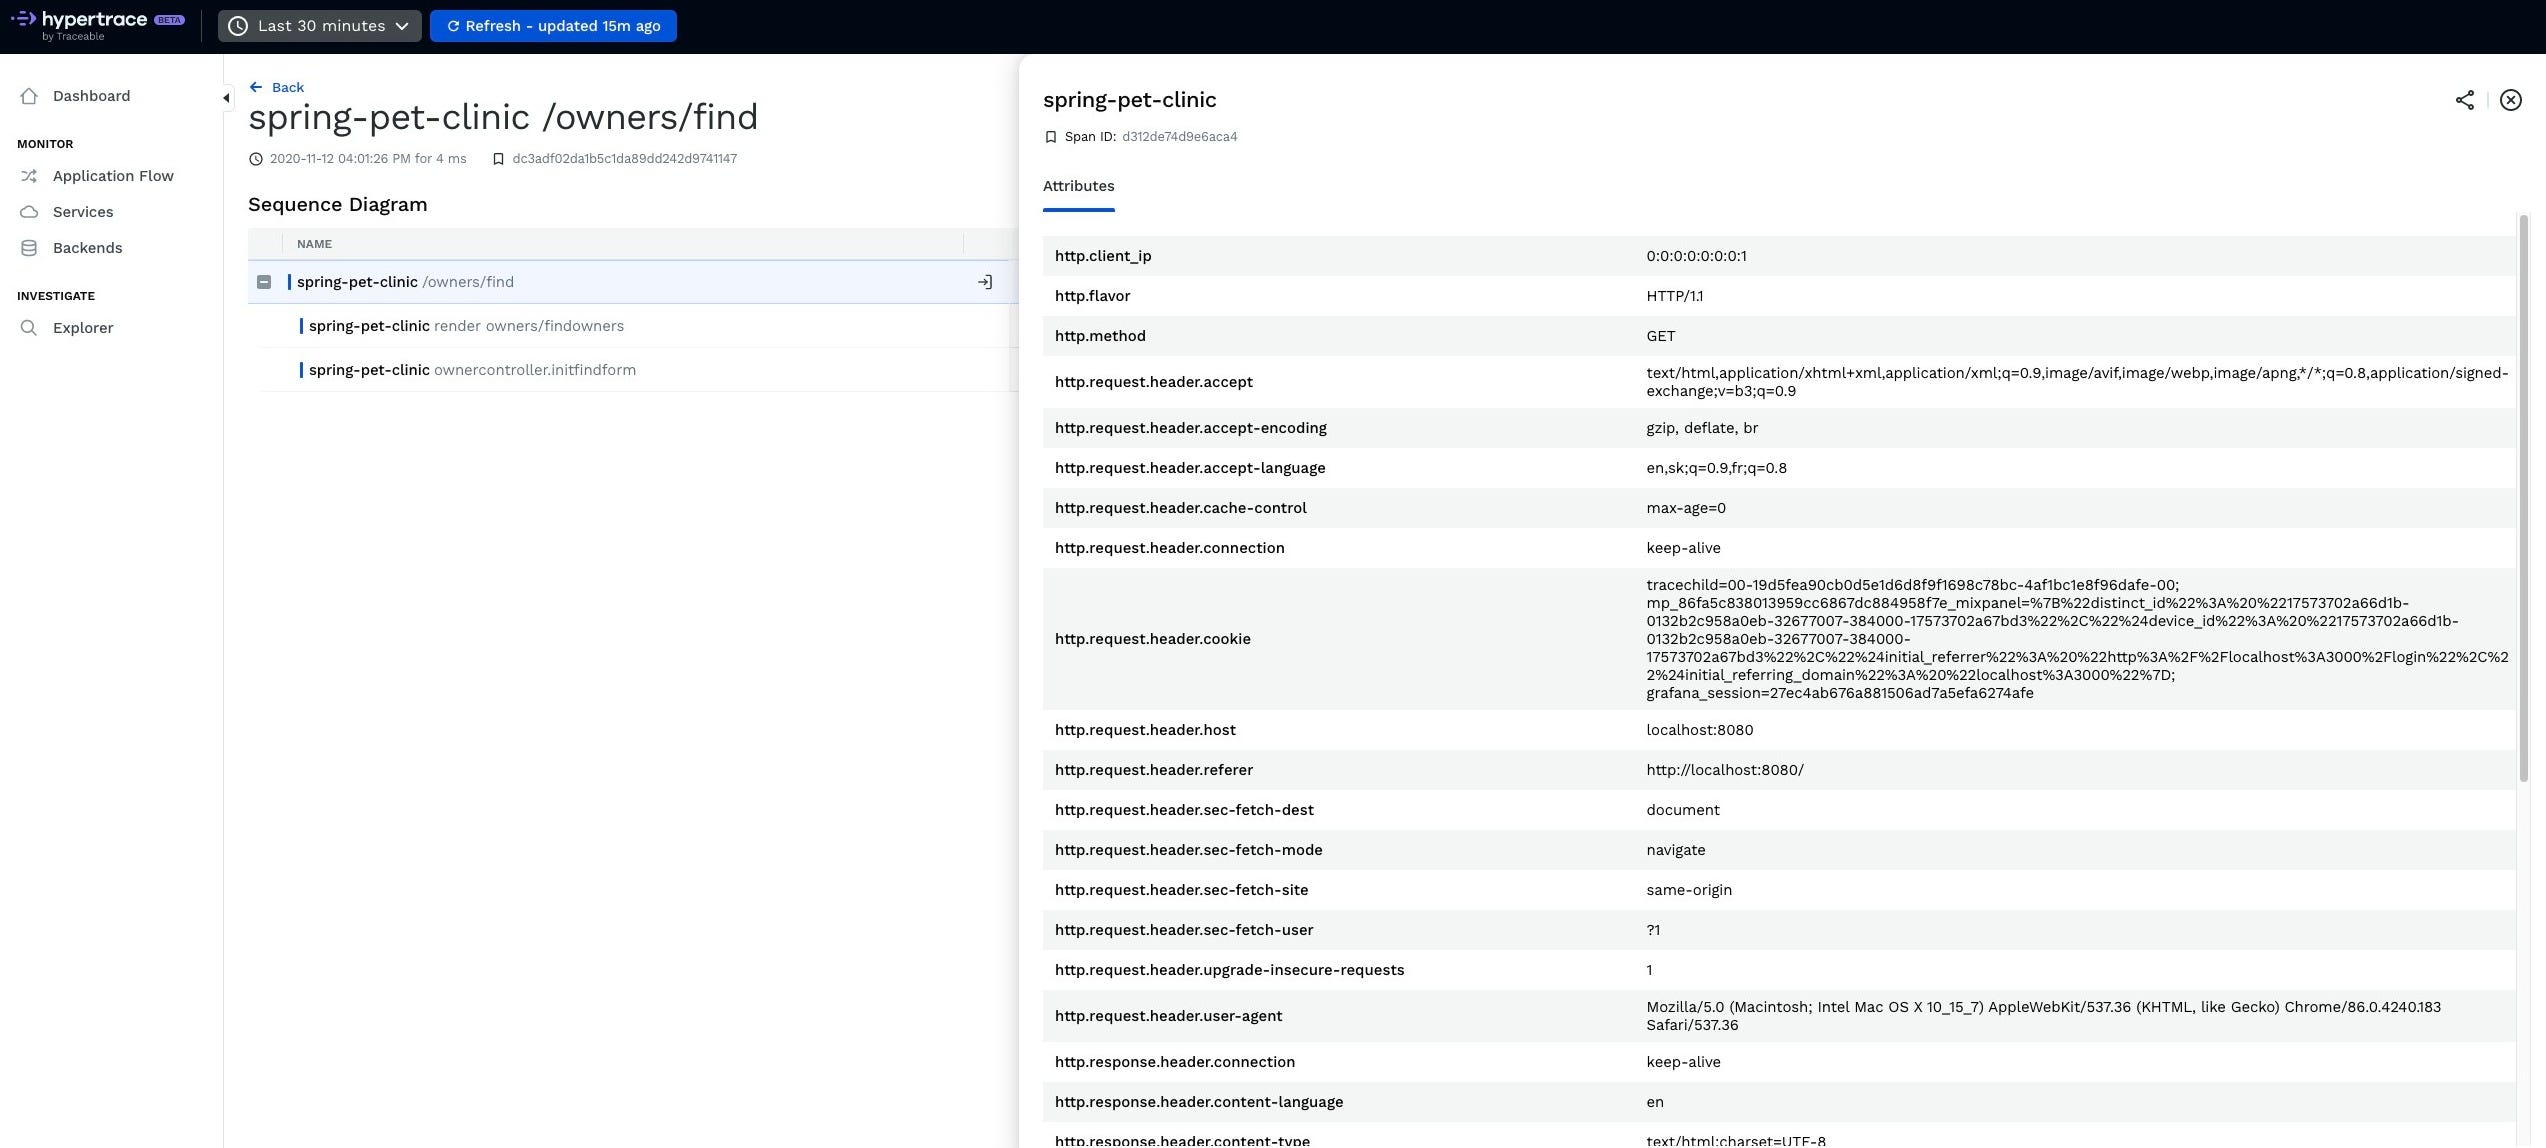
Last but not least, Lets view a trace view for one of the transactions. We see that there are 3 spans.
The request body wasn't captured because the content type is text/html, however all the headers are present in the trace.
 |
|---|
| Hypertrace trace detail |
The Hypertrace Java agent uses Zipkin exporter by default, hence you can try it out with any distributed tracing system that accepts Zipkin data.
Conclusion
We have described the additional features the Hypertrace Java agent offers on top of the OpenTelemetry Java agent. Keep in mind that the Hypertrace agent supports all frameworks which the OpenTelemetry java agent supports. The additional data capture and filtering currently supports these frameworks. We are at the very beginning of our journey with the Hypertrace agents. There are a lot of features to come: support for more frameworks, dynamic configuration, etc. If you want to get in touch with us, join our Hypertrace Slack channel or simply create an issue in our Java Agent repo.
References
- Hypertrace Java agent Github repository - https://github.com/hypertrace/javaagent
- Hypertrace specification - https://github.com/hypertrace/specification
- Hypertrace configuration - https://github.com/hypertrace/agent-config
- Spring Pet Clinic demo - https://github.com/spring-projects/spring-petclinic
| About author | |
|---|---|
| Pavol is a software engineer at Traceable working on data collection and Hypertrace. He is an open-source and technology enthusiast. In his free time he is skiing steep slopes in the Alps or climbing them. You can reach out to him on LinkedIn or @ploffay. |  |