Getting started with Hypertrace on Windows
Step-by-step tutorial for Hypertrace on Windows with Docker Compose.

Hypertrace is an open source distributed tracing and observability platform. It has numerous use-cases in the microservices world. If you live in a Windows world and want to try Hypertrace, this blog will help you to get started quickly.
Let's go step-by-step and see how you can get Hypertrace up and running with Docker Desktop on Windows 10. Specifically, I will use Windows 10 Professional on Intel core i7 for this quick demo!
Make sure you have Docker Desktop installed properly.
You need to install Docker Desktop to try Hypertrace on your Windows machine. If you have it installed already you can move to the next step. However, if you haven't then download Docker Desktop and run the installer. Detailed installation instructions are available in the Docker documentation.
Start Docker Desktop once you have it successfully installed. You should see the Docker icon in the status bar, like below.
![]()
Once Docker is running, continue to the next step.
Enable Linux containers
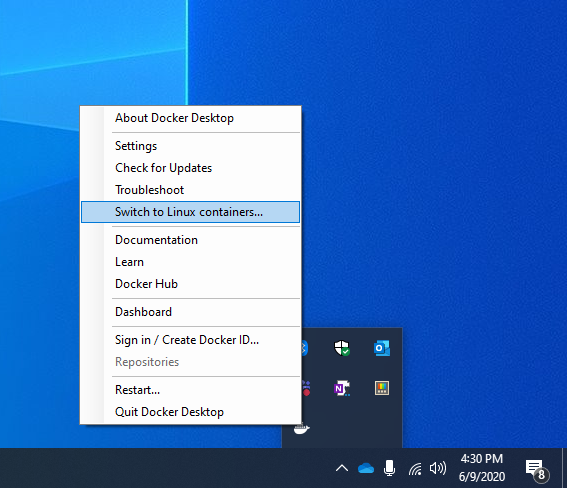
In order to run Linux containers, ensure that Docker is using the Linux daemon. You can toggle this by selecting Switch to Linux Containers from the action menu when clicking on the Docker whale icon in the system tray. If you see Switch to Windows Containers, then you are already targeting the Linux daemon.
 |
|---|
| Switch Daemons to use Linux containers |
Update Docker Resources
To run Hypertrace and the sample app, you should allocate about 4 GB of memory and 4 CPUs. With a powerful CPU, you may be able to run on less, but we have found this to be a good tradeoff. Most modern machines should be able to meet these requirements.
 |
|---|
| Docker Desktop resource allocation |
Clone the Hypertrace repo
git clone https://github.com/hypertrace/hypertrace
Run Docker Compose
To pull the images required for Hypertrace, navigate to the Docker folder and run docker-compose pull as shown below
cd hypertrace/docker
docker-compose -f docker-compose.yml pull
 |
|---|
| docker-compose pull |
Okay! Now that we have all of the images in place, let's start Hypertrace!
docker-compose -f docker-compose.yml up
Once you see the message started Hypertrace UI service on port 2020 as shown below, visit http://localhost:2020 to view Hypertrace in action.
 |
|---|
| docker-compose up |
Sending traces from the sample app
Well, that was easy! Now let's send some traces so that we can see Hypertrace in action and explore functionalities! If your application is already instrumented to send traces to Zipkin or Jaeger, it will work with Hypertrace out of the box.
Even if you don't have an application instrumented you can get started quickly with our simple sample application. To run the sample app, open another command prompt window and run
docker-compose -f docker-compose-zipkin-example.yml up
Open your web browser to http://localhost:8081 and refresh the web page a few times to generate some sample requests.
Now, go back to Hypertrace at http://localhost:2020 and click the Refresh button to see the traces and insights generated by your application using Hypertrace. It might take 10 seconds for your trace data to appear. But as they say, “Good things take time.”.
 |
|---|
| Hypertrace Dashboard |
If you need a platform and UI overview and want to understand what information each section serves, you can read the platform and UI overview here.
In a nutshell,
You can run Hypertrace on Windows 10 in 4 easy steps (if you have docker desktop installed!) and start exploring it right away with your own instrumented application or our sample application!
References
- Install Docker Desktop on Windows: https://docs.docker.com/docker-for-windows/install/
- User manual for Docker Desktop on Windows: https://docs.docker.com/docker-for-windows/
- How to use Linux containers, Install Docker on Windows and step by step detailed guide by Ubuntu: https://ubuntu.com/tutorials/windows-ubuntu-hyperv-containers#1-overview
- Run Linux containers on Docker Desktop for Windows by Microsoft: https://docs.microsoft.com/en-us/virtualization/windowscontainers/quick-start/quick-start-windows-10-linux
| About author | |
|---|---|
| Jayesh is founding engineer at Traceable and he works on Hypertrace and Hypertrace community building. He loves reading and you can find him on twitter and linkedin to discuss anything around tech. |  |